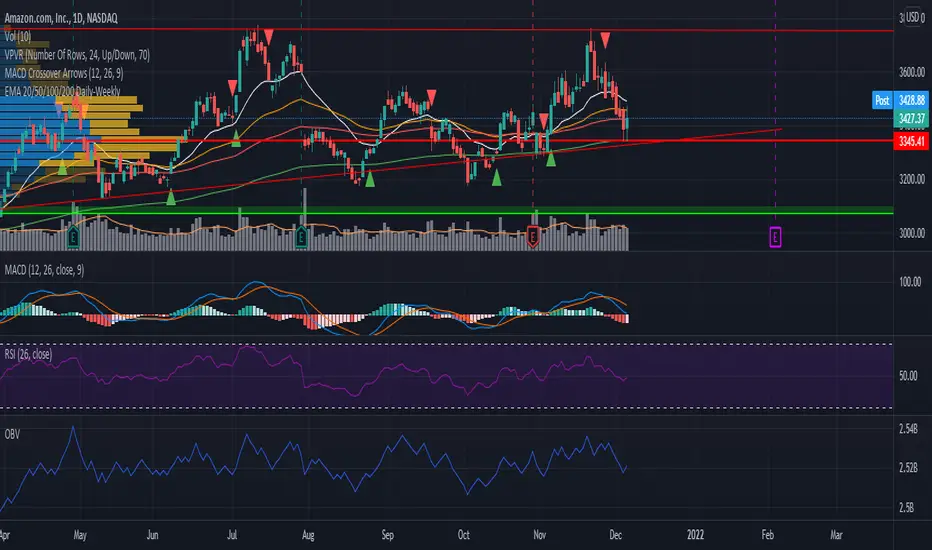
EMA 20/50/100/200 Daily-WeeklyHello!
In case this helps others when using EMA's on multiple timeframes, I decided to publish this script I modified.
It adds the EMA for 20/50/100/200 timeframes and gives them the color white, orange, red, green respectively.
The weekly timeframe will get the corresponding weekly EMA.
The monthly timeframe will get the corresponding monthly EMA.
The daily timeframe, and all timeframes below this, will get the daily timeframe. The idea that that a ticker symbol might respect with strength the daily EMA's - you'll be able to move to a smaller timeframe and still view the daily EMA's in an effort to better view how close the ticker came to taking a specific EMA.
Cerca negli script per "3 ema"
EMA 730 Ribbon MTF - Support and ReistanceThe EMA 730 line is a great way to show dynamic support and resistance . Price action travels "through" this line on each timeframe. This script pulls the EMA 730 Line from multiple timeframes so a trader can visually see price action bounce between support and resistance lines. Lower bands (white lines) can be turned off using "tickbox" in settings. EMA length can also be adjusted in settings. Some charts may work better with a length of 750.
Example of EMA Bands on lower timeframe.

EMA+RSI Pump & Drop Swing Sniper (With Alerts)This is using an EMA and RSI with slightly modified settings to give good entry and exit points while looking at Bitcoin. I use this on a 4-hour chart and with other indicators to find good positions to enter a trade or exit if things are turning red.
If you click on the EMA line it will color the bars of the chart based on if they are above or below the EMA - This is just visually helpful for me to see the active trend.
Make sure you hover over or click on the EMA line to see the colors of the candles change - it's not visible by default or without doing this.

Displaced EMA Channel[UO]Riding a bull run is almost always riding an EMA value. 21 is the default here and it is my favorite.
You buy the asset when it touches the EMA again. But where to sell?
This indicator plots displaced EMA values guggesting possible sell targets. EMA is displaced by a given target profit.
The default values are adjusted on AAVE.
Thus the indicator presents a custom channel for your trading

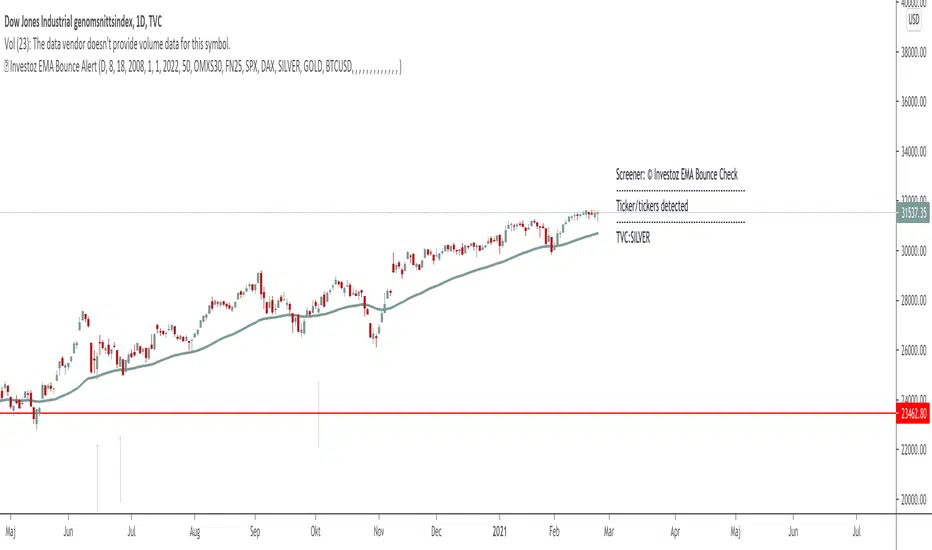
TheBlackFish EMA bounce alertAbout
This indicator is an EMA indicator with a built-in screener.
20 different ticker symbols are included in the screener. These ticker symbols must be replaced manually. All ticker symbols are from the Stockholm Stock Exchange, Large Cap.
How it works
The lowest price of a bar should be less than EMA and yesterday's closing greater than EMA.
If no conditions are found, there will be no ticker symbols in the box.
If the conditions are met, the ticker symbol / symbols are displayed in the black text box. The information in the box disappears after each new bar.
The default setting is set to EMA 50, but you can select which EMA value you want in its settings.
Change ticker
If you want to change the ticker symbol, do not forget to change both in "Check tickers" and in "Labels content".
Enjoy!
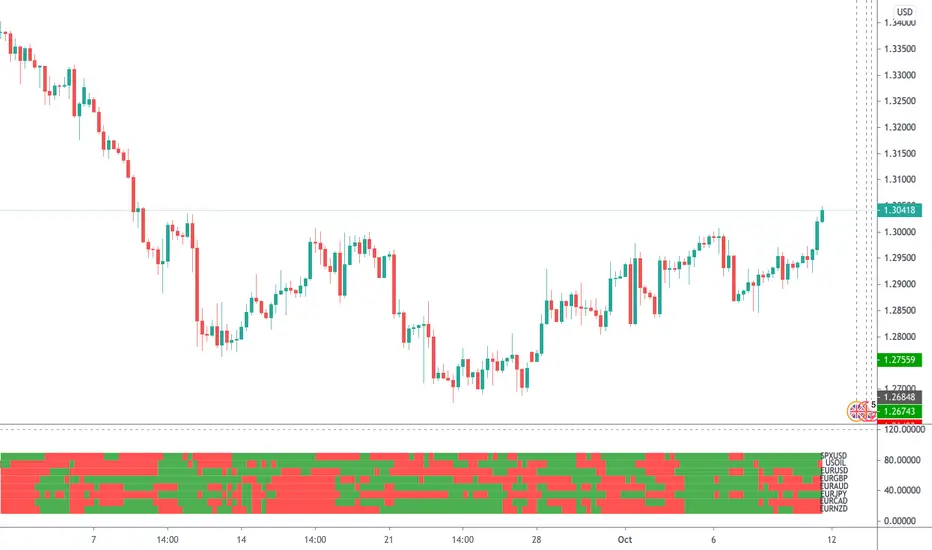
EMA Multi Currency RadarA simple indicator that illustrates where close price is in comparison to an MA. Just click the configure box and type in the EMA you want to monitor. The default is the 8 EMA .
To read the indictor:
- Green Line - Close price is above the EMA
- Red Line - Close price is below the EMA .
If you wish to have this indicator customised, please do not hesitate to contact me.
20 EMA Daytrading Strategy20 EMA Daytrading Strategy
This strategy creates long and short signals based on a 20 EMA crossing condition. Works well in 4H timeframes or higher. Accuracy is around 60%.
BUY
When a green candle crosses above 20 EMA
Followed by another green candle which closes above the previous candle high
SELL
When a red candle crosses below 20 EMA
Followed by another red candle which closes below the previous candle low
Stop loss at ATR + 5
Take Profit at 1.3R

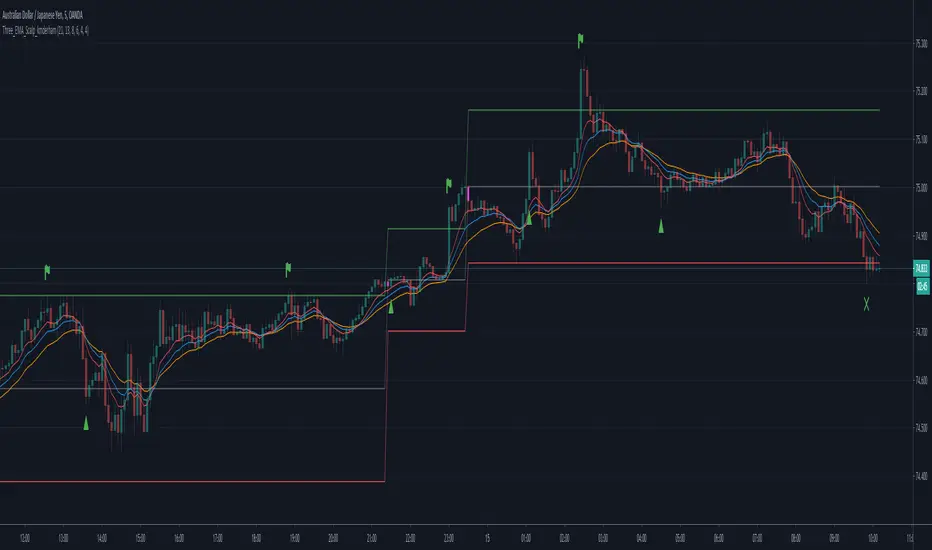
Three EMA Scalp Signals by kmderhamThis script looks for a set up condition where 5 consecutive candles have broken away from the fast EMA (set to 8 by default) followed by a "trigger" candle that crosses back over the fast EMA but not the medium EMA (set to 13 by default). It then determines the entry point based on the bar high or low (not tail or wick) depending on direction of the trend. Once the entry point is crossed, we can enter the position. Win or loss is determined whether the lower or upper levels are crossed (as per trend). After the position is won or lost and if the entry level is re-crossed before a new set up condition is found then a new entry signal is given.
Please note that this should really be used in conjunction with a higher timeframe "Anchor" chart with a fast and a slow EMA so setups and positions should should correspond to the trend of the higher timeframe chart. This was designed for a 5 minute timeframe and a 60 minute anchor chart.
EMA CandlesIndicator that draws EMA candles as overlay. Uses the EMA values for Open, Close, High, and Low each individually to draw each EMA candle. Set at 30 bar EMA by default.
EMA Noodle Fan by KviateqJust a very simple EMA fan using Highs and Lows instead of closes. This results in these "EMA noodles". Price very rarely reacts rigidly to a close price of an EMA, sometimes it comes short, other times it overshoots it. Hence the idea behind the noodles.
You can obviously change the lengths of each of the noodle, I chose these lengths for a M5 timeframe and these represent your typical 50, 100 and 200 EMAs on higher timeframes.

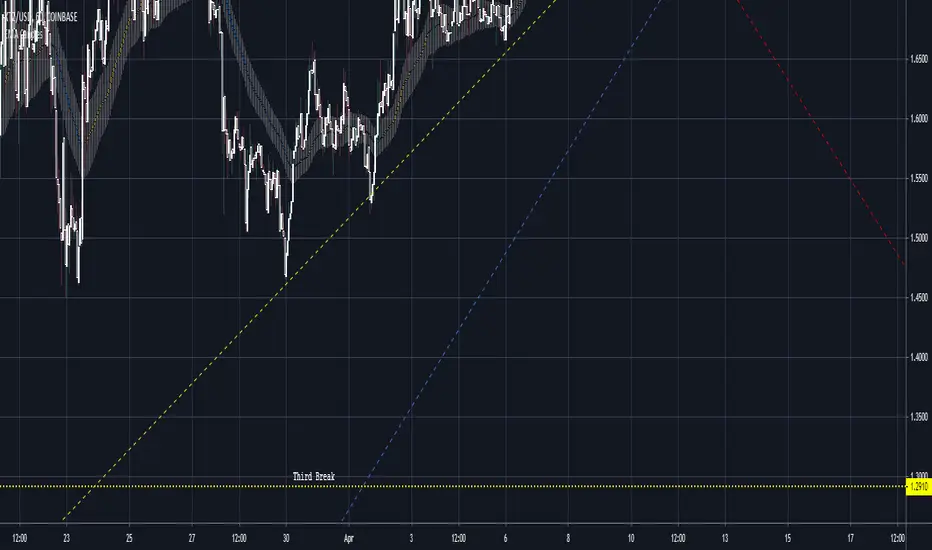
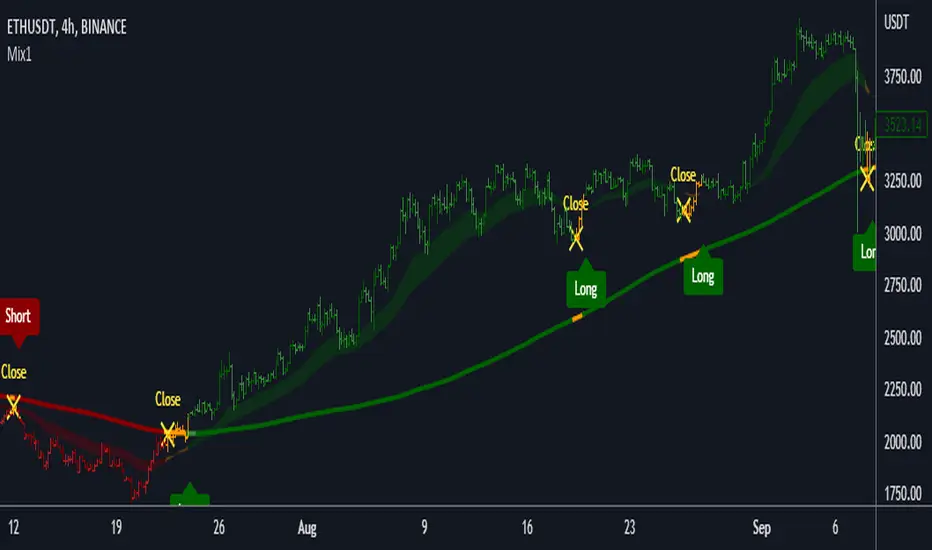
Mix1 : Ema Cross + Trend Channel [Gu5]Based on Trend Channel
Ema-crossover is added
Crossing alerts, only on trend
Basado en mi anterior indicador, Trend Channel
Se agrega Cruce de Medias Moviles (Ema-crossover)
Las alertas solo son en favor a la tendencia
El valor de SMA Range es arbitrario (No Backtesting). Cambia la amplitud de canal que determina cuando es rango (barras amarillas por estar muy cerca del SMA200, sin tendencia definida)
Range Multiplier adapta el indicador a distintos mercados
//Setting recommended for SMA Range
//BTCUSD = 100
//EURUSD = 1000
//SPX = 100
//ETHUSD = 10
Si te fue útil este indicador, puedes comprarme una cerveza ;)
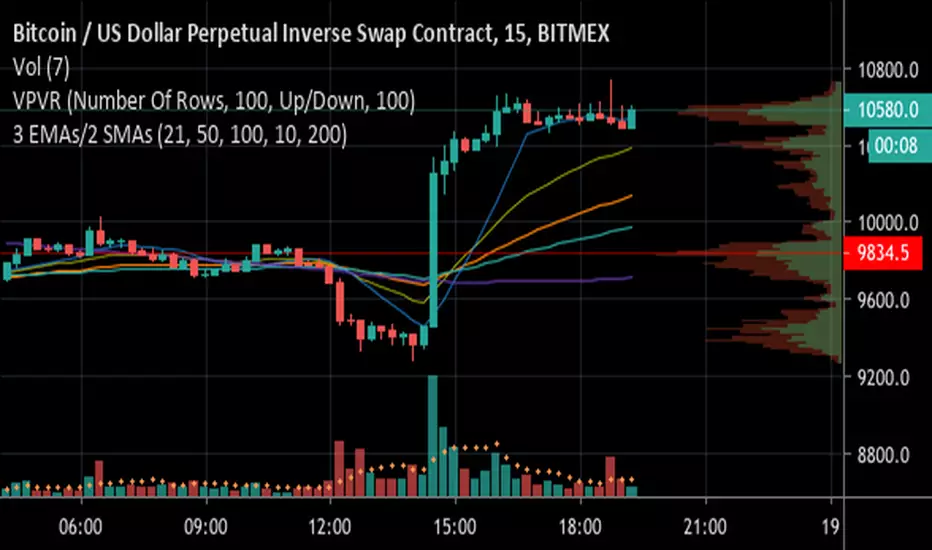
3 EMAs with Crossing Alerts & 2 SMAsHi all,
This is a simple indicator that plots 3 EMA lines and 2MAs of your choice to the screen and has built in alert triggers.
Features:
1) Alerts are triggered when EMAs 1 (Signal line) and 2 (Baseline) cross - a Long signal is called if the cross is above EMA 3 ( Trendline ), a short if the cross is below EMA3
2) Signals are represented visually as a triangle on the chart, below the candles is a long, above is a short
3) TradingView Alerts can be easily set as I have labelled the signals clearly as many other Indicators like this aren’t easy to work out if trying to create alerts to trigger a 3commas bot, for example!
Each EMA is fully customisable and if you wish to take advantage of the alerts, only a few simple rules need to be followed:
EMA1 needs to be less than EMA2.
EMA2 needs to be the same or greater than EMA3
That’s it, happy trading!
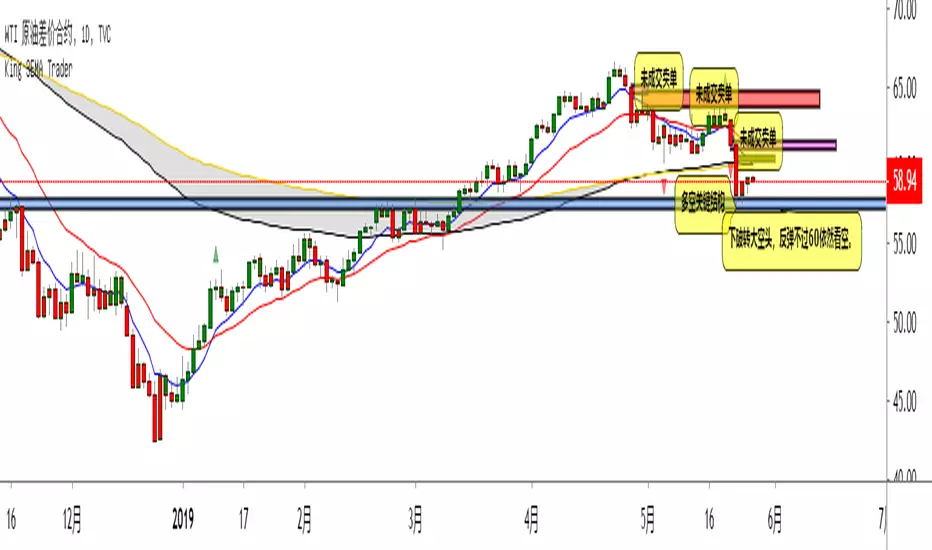
Edward EMA 8-21-89-144Explain the application of moving averages through the disk surface:
When the price runs above 89, it only looks for the buy signal.
When the price runs below 89, it only looks for sell signals.
The first step up through the 89 moving average after the first confirmation can buy homeoply,
The first pull down after crossing the 89 moving average for the first time confirms that it can be sold in line with the trend.
Price horizontal finishing, moving average frequently across the field observation.
The yellow area in the interval from 8 to 21 is the homeopathic warehouse addition signal.
When the price is above the 89 moving average, the k-line closes below the 21-day moving average as a callback signal
Prices below the 89 ema close above the 21 - day ema as a rebound signal
After the correction and rebound signals come out, we should make half of the profit and the other half of the stop loss in the break-even place.
Moving average is very suitable for the trend of strong varieties, is not suitable for volatile market.
Only at the end of the shock market moving average upward or downward divergent when it is possible to be used.
1. Repeatedly entangle the mean line of horizontal disk stage and observe it from the field
2. Sell the three EMA moving averages when they can't exceed 89EMA with downward crossing
3, many times can not break the new low when prices go sideways profit
4. Buy when the price reaches 89EMA after the convergence of triangle 3 is broken
5, the Angle of price rise slowed and closed below the 21 moving average when profit
6. Left field observation during transverse oscillation.
Sit tight while news or data cause prices to fall quickly
8. Buy when the price triangle breaks through the 89 moving average upward
9, the price does not rise to slow down when the horizontal closed below the 21 moving average when profit
10, price horizontal shock finishing at the same time the average line also transverse finishing field observation
11, the price of the triangle after finishing through the 89 moving average to buy.At this point all the averages have turned up
12, the second time can not break through the new high when the negative line can profit
13, the price of the first time in the same period of time through 89 after the first step back can be re-bought.
通过盘面讲解均线运用:
价格在89上面运行时时只找买入信号、
价格在89下面运行时只寻找卖出信号、
第一次向上穿过89均线后的第一次回踩确认可以顺势买入、
第一次向下穿过89均线后的第一次回抽确认可以顺势卖出、
价格横盘整理,均线频繁穿越时离场观察。
8-21区间里面黄色区域为顺势加仓信号,
价格在89均线上面时K线收盘在21天均线下面时为回调信号
价格在89均线下面时K线收盘在21天均线上面时为反弹信号
在回调和反弹信号出来之后我们应该获利一半的头寸,另外一半止损放到盈亏平衡的地方。
均线非常适合趋势性很强的品种,并不适合震荡行情。
只有在震荡行情结束时均线向上或向下发散时才有被运用的可能。
1、横盘阶段均线反复纠缠,离场观察
2、三条EMA均线向下交叉回抽无法超越89EMA时卖出
3、多次不能破新低时价格走横时获利
4、价格在3处三角形收敛被突破后站上了89EMA时买入
5、价格上涨角度变缓并收盘在21均线下面时获利
6、横盘震荡时离场观察。
7、见死不救新闻或数据导致价格快速下跌时观望
8、价格三角形向上突破时穿过89均线时买入
9、价格不升减速走横时收盘于21均线下面时获利
10、价格横盘震荡整理同时均线也横向整理时离场观察
11、价格突破三角形整理后重新穿过89均线时买入。此时所有均线已经向上翘头
12、第二次不能突破新高时收阴线可以获利
13、价格在同一个时间周期内第一次穿过89以后的第一次回踩可以重新买入
14、89-144作为牛熊的分水岭。在89-144区域之下只考虑做空,89-144只考虑做多。如果89-144走横则以位置决定高位倾向空低位倾向多。
15、K线会因为指标的设置自动变成两个颜色块,绿色看涨,红色看跌。做趋势看K线颜色。牛市的红色可以当成入场K熊市绿色当成入场K

Weekly EMAs (Slow, Mid, Fast)This indicator plots on your chart 3 EMAs (customizable) from the Weekly timeframe (resolution).
The default settings (all EMAs)
200 - Orange
50 - Purple
20 - Black
There is no smoothing so the EMA line will appear jagged.
I start my week with understanding the bias on a weekly timeframe and weekly chart setups but I find it useful to have these weekly EMAs on different resolutions (especially the Daily).

Multiple EMA/SMA v6This indicator plots up to eight Exponential Moving Averages (EMAs) and six Simple Moving Averages (SMAs) on the same chart.
Each moving average can be individually customized or disabled by setting its length to 0.
It’s designed for traders who want to visually compare multiple EMAs and SMAs with consistent styling and color-coding.
Key features:
Displays up to 14 customizable EMAs/SMAs.
Adjustable line width and source (e.g., close, open, hlc3).
Simple and performance-optimized structure.
Clean color scheme for quick trend identification.
Usage:
Set any moving average length to 0 to hide it, or adjust lengths and colors to match your strategy.
Ideal for identifying short-, mid-, and long-term trend alignments.

Anrazzi - EMAs/ATR - 1.0.2Description:
The Anrazzi - EMAs/ATR indicator is a versatile tool for technical traders looking to monitor multiple moving averages alongside the Average True Range (ATR) on any chart. Designed for simplicity and customization, it allows traders to visualize up to six moving averages with configurable type, color, and length, while keeping real-time volatility information via ATR directly on the chart.
This indicator is perfect for spotting trends, identifying support/resistance zones, and gauging market volatility for intraday or swing trading strategies.
Key Features:
Supports up to six independent moving averages (MA1 → MA6)
Each MA is fully customizable:
Enable/disable individually
Type: EMA or SMA
Length
Color
ATR Display:
Custom timeframe
Color and position configurable
Adjustable multiplier
Compact and organized settings for easy configuration
Lightweight and efficient code for smooth chart performance
Watermark
Inputs / Settings:
MA Options: MA1 → MA6 (Enable/Disable, Type, Length, Color)
Additional Settings: ATR (Enable, Timeframe, Color, Multiplier)
How to Use:
Enable the moving averages you want to track
Configure type, length, and color for each MA
Enable ATR if needed and adjust settings
Watch MAs plotted dynamically and ATR in bottom-right corner
Recommended For:
Day traders and swing traders
Trend-following strategies
Volatility analysis and breakout detection
Traders needing a compact multi-MA dashboard

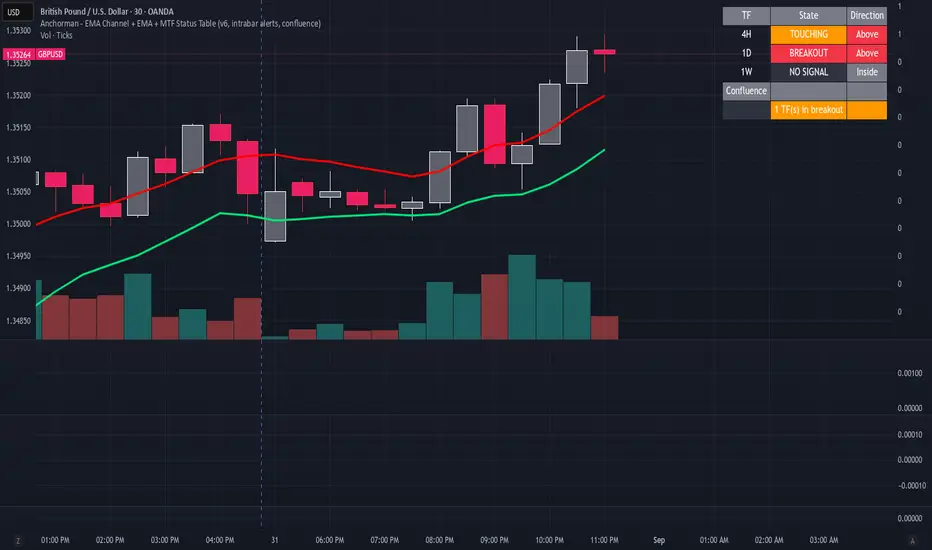
Anchorman - EMA Channel + EMA + MTF Status Table PRICE BREAKOUTUses a high/low EMA Channel to tell you when strong price breakouts are happening plus comes with a EMA to help follow the trend if you like. I designed it so it can alert you when a single TF touch happens or a breakout alignment on MTF happens (I recommend this) its up to you also its single alert so no need to do bullish or bearish signals just one signal will alert you when a breakout happens in EITHER direction.
All-in-One EMA & BBThis script combines Bollinger Bands and multiple EMAs into one powerful tool. It includes:
1) Bollinger Bands with customizable MA type and colors.
2) EMA 21 on Daily and Weekly timeframes.
3) EMA 21, 50, 100, 200 on current chart timeframe.
4) Toggle options for each indicator for a clean, flexible view.
Ideal for traders seeking multi-timeframe trend analysis and volatility insights.

Blended EMA (9 & 20)Shows EMA 9, EMA 20, and their blended average
Toggle to hide/show the original EMAs
Clean, easy to read — ideal for entry setups on lower timeframes
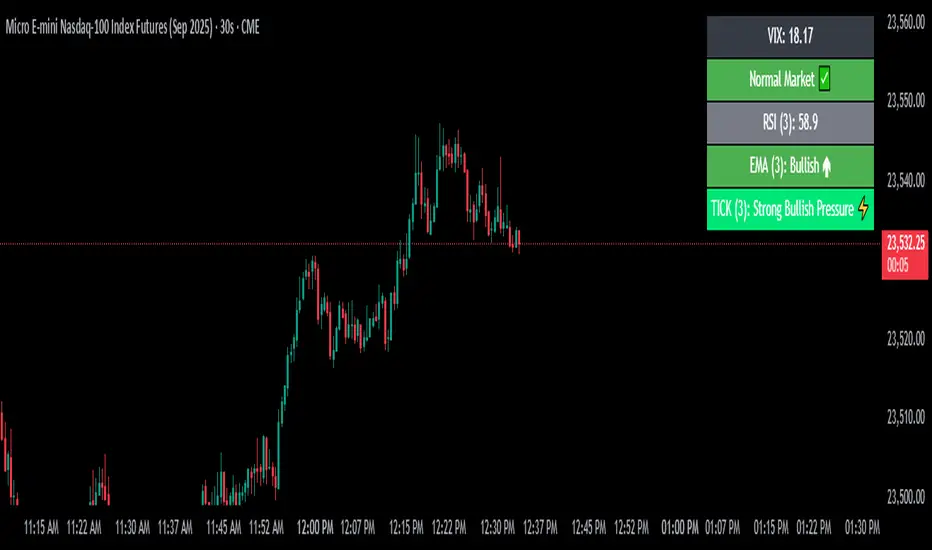
VIX Filter/RSI/EMA Bias/Cum-TICK w/ Exhaustion Zone DashboardThis all-in-one dashboard gives intraday traders a real-time visual read of market conditions, combining volatility regime, trend bias, momentum exhaustion, and internal strength — all in a fully customizable overlay that won’t clutter your chart.
📉 VIX Market Regime Detector
Identifies "Weak", "Normal", "Volatile", or "Danger" market states based on customizable VIX ranges and symbol (e.g., VXN or VIX).
📊 RSI Momentum Readout
Displays real-time RSI from any selected timeframe or symbol, with adjustable length, OB/OS thresholds, and color-coded exhaustion alerts.
📈 EMA Trend Bias Scanner
Compares fast and slow EMAs to define bullish or bearish bias, using your preferred timeframe, symbol, and EMA lengths — ideal for multi-timeframe setups.
🧠 Cumulative TICK Pressure & Exhaustion Engine
Analyzes internal market strength using cumulative TICK data to classify conditions as:
-Strong / Mild Bullish or Bearish Pressure
-Choppy / No Edge
-⚠️ Exhaustion Zones — when raw TICK values hit extreme highs/lows, a separate highlight box appears in the dashboard, warning of potential turning points
All logic is customizable, including TICK symbol, timeframes, thresholds, and lookback periods.
Scalpers and day traders who want fast, visual insight into market internals, exhaustion, and trend bias.
5 EMA STRATEGY by Power of Stocks(StockYogi)5 EMA STRATEGY by Power of Stocks(StockYogi)
This is a 5 EMA Breakout Strategy inspired by the trading principles taught by Shubhashi Pani, founder of the Power of Stocks (POS) community.
The strategy is designed to:
• Detect breakout setups when price breaks the high/low of a signal candle (based on EMA conditions)
• Enter trades only if the breakout occurs within the next 3 candles
• Allow multiple trades in the same direction without closing the earlier one
• Use independent stop-loss (SL) and take-profit (TP) targets for each trade based on a user-defined risk-reward ratio
• Optionally enter trades only at candle close
• Optionally avoid trades during a custom time window (e.g., 3:00 PM to 3:30 PM IST)
• Optionally close all open positions at a defined time (e.g., 3:30 PM IST)
The goal of this strategy is to provide greater flexibility and realism for intraday or short-term traders following structured breakout systems.
Disclaimer: This script is an implementation of technical ideas for educational purposes only. It is not financial advice. All trading involves risk, and past performance does not guarantee future results.
Strategy Credits:
This strategy is based on publicly known breakout rules taught by Shubhashi Pani (Power of Stocks). This is not an official POS script, and I am not affiliated with the Power of Stocks team. This implementation was developed independently to follow the logic shared for educational use.
Feel free to use, backtest, and modify according to your needs. Constructive feedback is welcome!

EMA Break & Retest + Trend TableThis script is designed to identify potential buy and sell trading opportunities based on 21 EMA (Exponential Moving Average) break and retest patterns, with confirmation from multi-timeframe trend analysis. It combines actionable signal generation with a clean, real-time trend overview table.
✅ 1. EMA Break & Retest Logic
Detects when the price crosses above or below the 21 EMA and then closes in the direction of the breakout.
Generates buy signals on upward break/retest, and sell signals on downward break/retest.
✅ 2. Multi-Timeframe Confirmation
Filters signals using higher timeframe trends to avoid false entries.
Buy signals are shown only if the 1H or 4H trend is bullish.
Sell signals are shown only if the 1H or 4H trend is bearish.
✅ 3. Visual Signal Plotting
Displays green "BUY" labels below bars and red "SELL" labels above bars.
Users can toggle buy/sell signals on or off with checkboxes.
✅ 4. Alerts
Built-in alertcondition() functions allow traders to set real-time alerts when buy or sell signals are triggered.
✅ 5. Multi-Timeframe Trend Table
A dynamic table appears in the top-right corner showing trend status across:
Daily (D)
4 Hour (4H)
1 Hour (1H)
15 Minute (15M)
5 Minute (5M)
Each timeframe is marked as Bullish (green) or Bearish (red) depending on the current price vs. 21 EMA.
The latest signal (“BUY” / “SELL” / “—”) is displayed at the bottom of the table.